Rayleigh-Rice Mixture Model Estimation
Problem in hand
Consider the data with all positive values denoted as for all . It is desired to find an unsupervised threshold such that we say for the data point belongs to a class otherwise the data point belongs to the other class. In order to find such a threshold without introducing any extra parameters we use a Rayleigh-Rice mixture model. Note that the values of are positive and Rayleigh-Rice mixture models these values very well. Once the Rayleigh-Rice mixture model is fitted, the intersection of the two distributions is the threshold value.
Rayleigh-Rice mixture
Let indicate the probability that a sample is from a Rayleigh distribution with parameter and the probability that is from the Rice distribution with parameters and . Then, the distribution of the mixture model can be written as
where and
and
with is the 0-th order modified Bessel function of first kind. Given the samples we want to find the parameters of this model (). Expectation-Maximization (EM) algorithm can be used to estimate the model parameters . Following algorithm shows the steps of the EM for fitting the Rayleigh-Rice model.
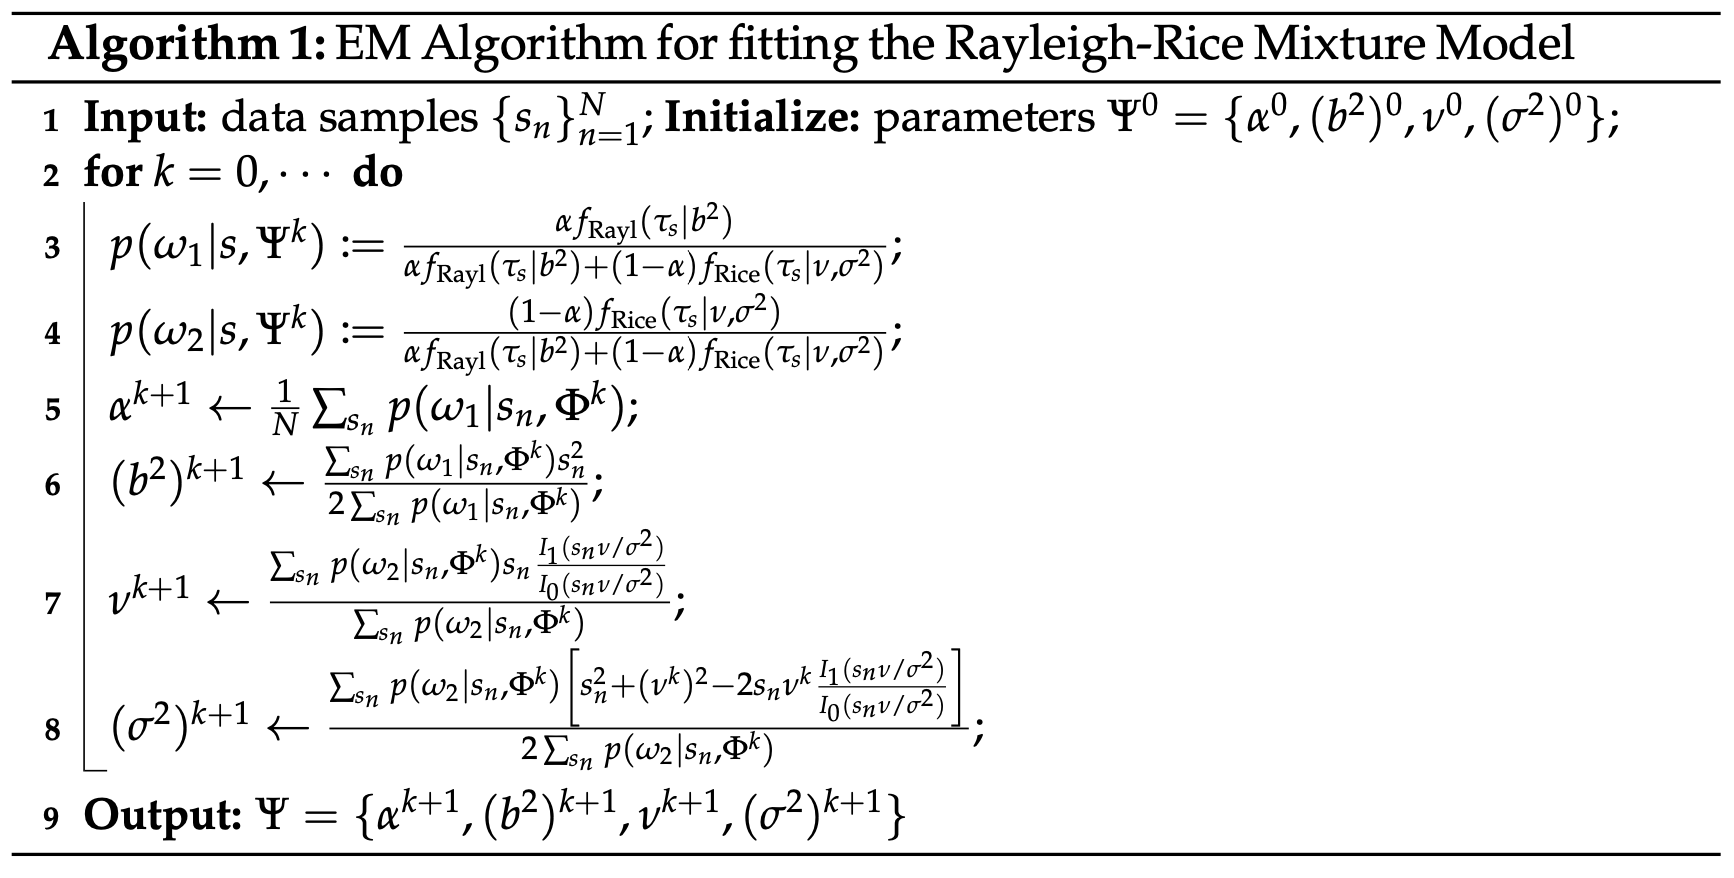
Given the fitted model parameters the threshold value is found by solving the following for .
Sample Result
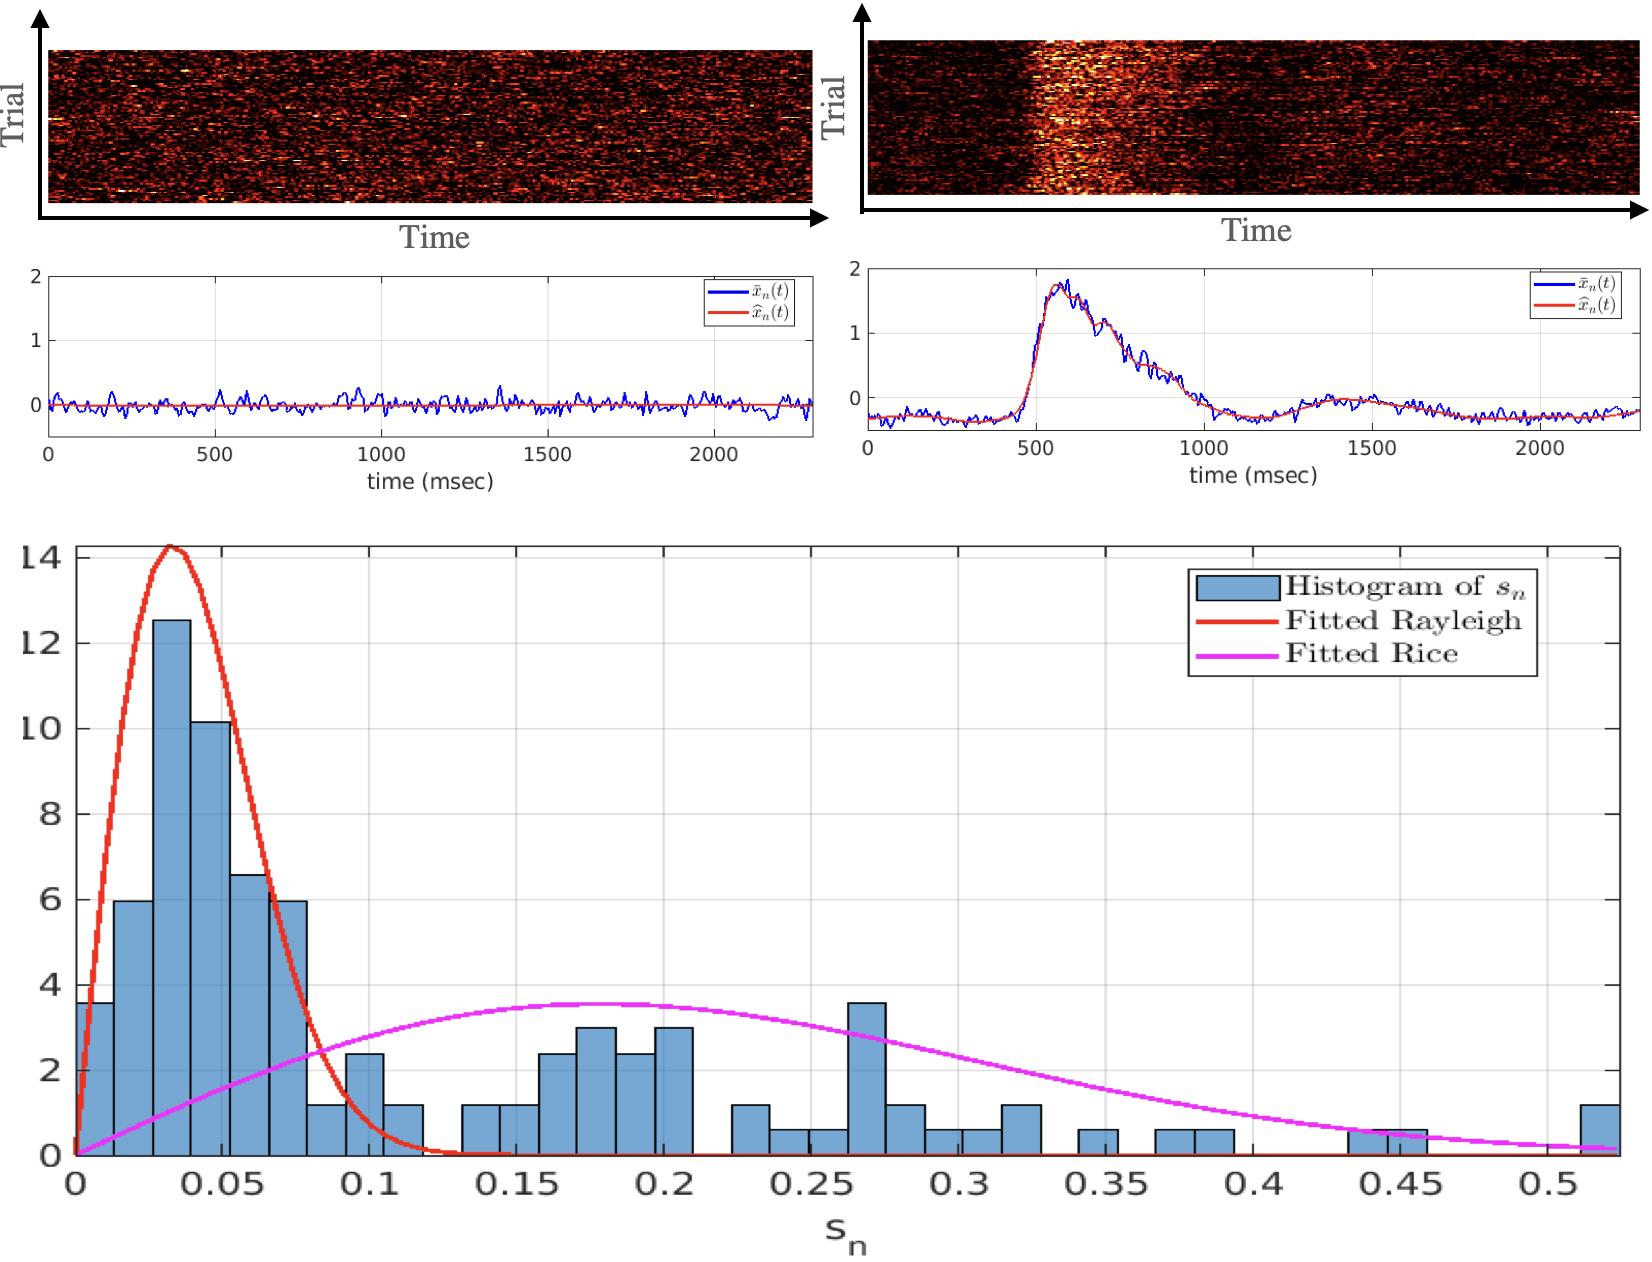
A sample histogram of for all is shown in figure. The plotted curves show the fitted Rayleigh and Rice distributions. In this example, the values of denote the standard deviation of electrode activity and the fitted model separates the active and inactive electrodes.
Matlab implementation
The matlab implementation is provided here.